Elevate your career with our comprehensive 6-month Advanced Program in Data Science, certified by Acacia University. This professional development program equips you with in-demand skills in Python programming, data analytics, machine learning, and AI implementation through 80 hours of live instructor-led training.
Master the complete data science ecosystem with hands-on experience using industry-leading tools and frameworks. Our Advanced Program in Data Science equips you with practical skills in Python programming, data manipulation, visualization, and machine learning – preparing you for real-world data challenges.
Master the complete data science ecosystem with hands-on experience using industry-leading tools and frameworks. Our Advanced Program in Data Science equips you with practical skills in Python programming, data manipulation, visualization, and machine learning – preparing you for real-world data challenges.
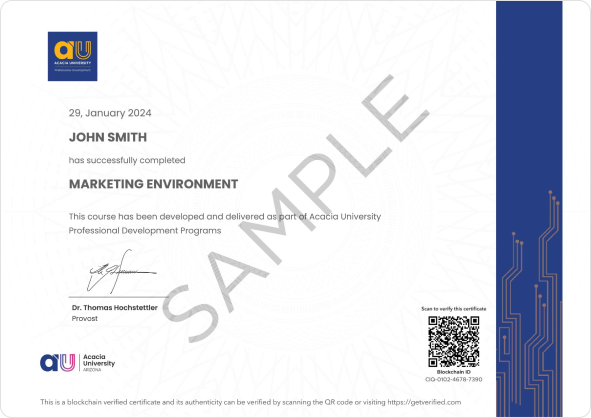
Acacia University Professional Development has initiated various programs in partnership with Airtics Education. The wide range of programs aims to upskill millions of students in trending technologies through a blend of theoretical and hands-on knowledge and are taught by leading academicians.
Airtics Education’s Advanced Programs are offered as part of Acacia University Professional Development Programs, and the learners are certified by the University.
Eligibility
This course is well suited for participants of all levels of experience because of the high demand for Data Science with Python programmers. Data Science with Python is beneficial for analytics professionals interested in Python, software and IT professionals interested in Analytics, as well as anyone with a genuine interest in Data Science.
Prerequisites
Good to have familiarity with basic concepts of mathematics and programming knowledge. Basic knowledge of Database tools and workflow will be a plus.
Learn the core structure and functionality of Python—covering syntax, variables, data types, conditionals, loops, and functions. This module sets the foundation for data-centric programming and analysis.
Working with Python Libraries
Dive into essential Python libraries used in data science. Understand how to manipulate arrays using NumPy, handle dataframes with Pandas, and create visualizations with Matplotlib.
Preparing for Data Analytics and Machine Learning
Acquire the programming confidence needed for more advanced analytics modules. Build a strong base in Python that enables you to transition smoothly into data science, machine learning, and AI.
Learning Outcomes
Module Duration: 3–4 weeks
By completing this module, you will:
Learn the core structure and flow of Python programming
Understand how to write and organize Python programs with conditional statements and functions
Gain practical knowledge of key Python libraries like NumPy, Pandas, and Matplotlib
Build a strong Python foundation for progressing into advanced analytics, ML, and data manipulation
Mathematical Foundations for Data Analysis
Gain a solid grasp of linear algebra, probability, and statistics—core areas essential for handling data and performing precise analysis. Understand distributions, averages, variance, and the fundamentals of statistical thinking.
Practical Tools and Data Handling
Explore tools like CSV and Excel for managing datasets, and apply statistical tools to clean and prepare raw data. Learn to manipulate, reshape, and process data efficiently using popular libraries such as NumPy and Pandas.
From Messy Data to Meaningful Insights
Learn the methods to identify and fix missing values, duplicates, and incorrectly formatted data. This module lays the groundwork for accurate analytics by teaching the principles of data treatment before modeling.
Learning Outcomes
Module Duration: 4–5 weeks
By completing this module, you will:
Master the essentials of probability, statistics, and linear algebra in the context of data science
Understand and apply basic statistical tools for working with structured and unstructured data
Learn to clean, import, and explore data using CSV, Excel, and Python libraries like NumPy and Pandas
Fix incorrect, corrupted, duplicate, or incomplete data using standard preprocessing techniques
Prepare data for machine learning models through statistical analysis and visualization
Foundations of Data Representation
Begin your journey with an introduction to data visualization and understand how visual context helps interpret large datasets effectively. Learn how different types of charts—bar, pie, line, scatter, heatmaps, and more—are used to represent diverse data types and uncover insights.
Hands-on SQL and Database Skills
Explore the role of SQL in querying, managing, and organizing structured data. Learn about relational databases, table structures, and key SQL commands such as SELECT, JOIN, GROUP BY, and more. Understand how databases form the backbone of modern data systems.
From Raw Data to Actionable Insights
Develop the ability to convert unstructured and structured data into meaningful visual reports and dashboards. Work with tools and techniques that help in structuring and analyzing data for business decision-making.
Learning Outcomes
Module Duration: 3–5 weeks
By completing this module, you will:
Understand the core concepts of data visualization and how different chart types are used
Learn the fundamentals of SQL and relational databases for managing structured datasets
Apply SQL commands to query, manipulate, and retrieve data efficiently
Gain hands-on experience in transforming raw data into insightful visual representations
Build complete data analysis projects that drive meaningful business decisions
Develop the mindset and adaptability needed to keep pace with evolving data tools and techniques
Mastering Power BI Interface & Views
Gain proficiency in Power BI’s core interfaces—Data View, Model View, and Report View. Learn how to work across these views to manage data models, design visuals, and craft dynamic reports.
Transforming and Filtering Data Effectively
Understand how to use Power Query Editor to clean, shape, and transform raw data before analysis. Apply essential filtering techniques to control how data is displayed across various visuals and geographical layers.
Creating Impactful Reports & Visual Hierarchies
Learn to build and customize visuals, manage hierarchies, and implement drill-down features for interactive reports. Utilize Power BI’s tools to sort and organize data for clear, actionable insights.
Learning Outcomes
Module Duration: 2–3 weeks
By completing this module, you will:
Understand the functionality of Power BI’s Data, Model, and Report Views
Format a wide range of visualizations and create drill-down reports using hierarchies
Perform data transformation and preparation using Power Query Editor
Apply sorting, filtering, and interactivity to enhance visual storytelling
Control how filters impact visuals within your reports, including location-based filtering
Gain hands-on experience with Excel tools integrated into the Power BI environment
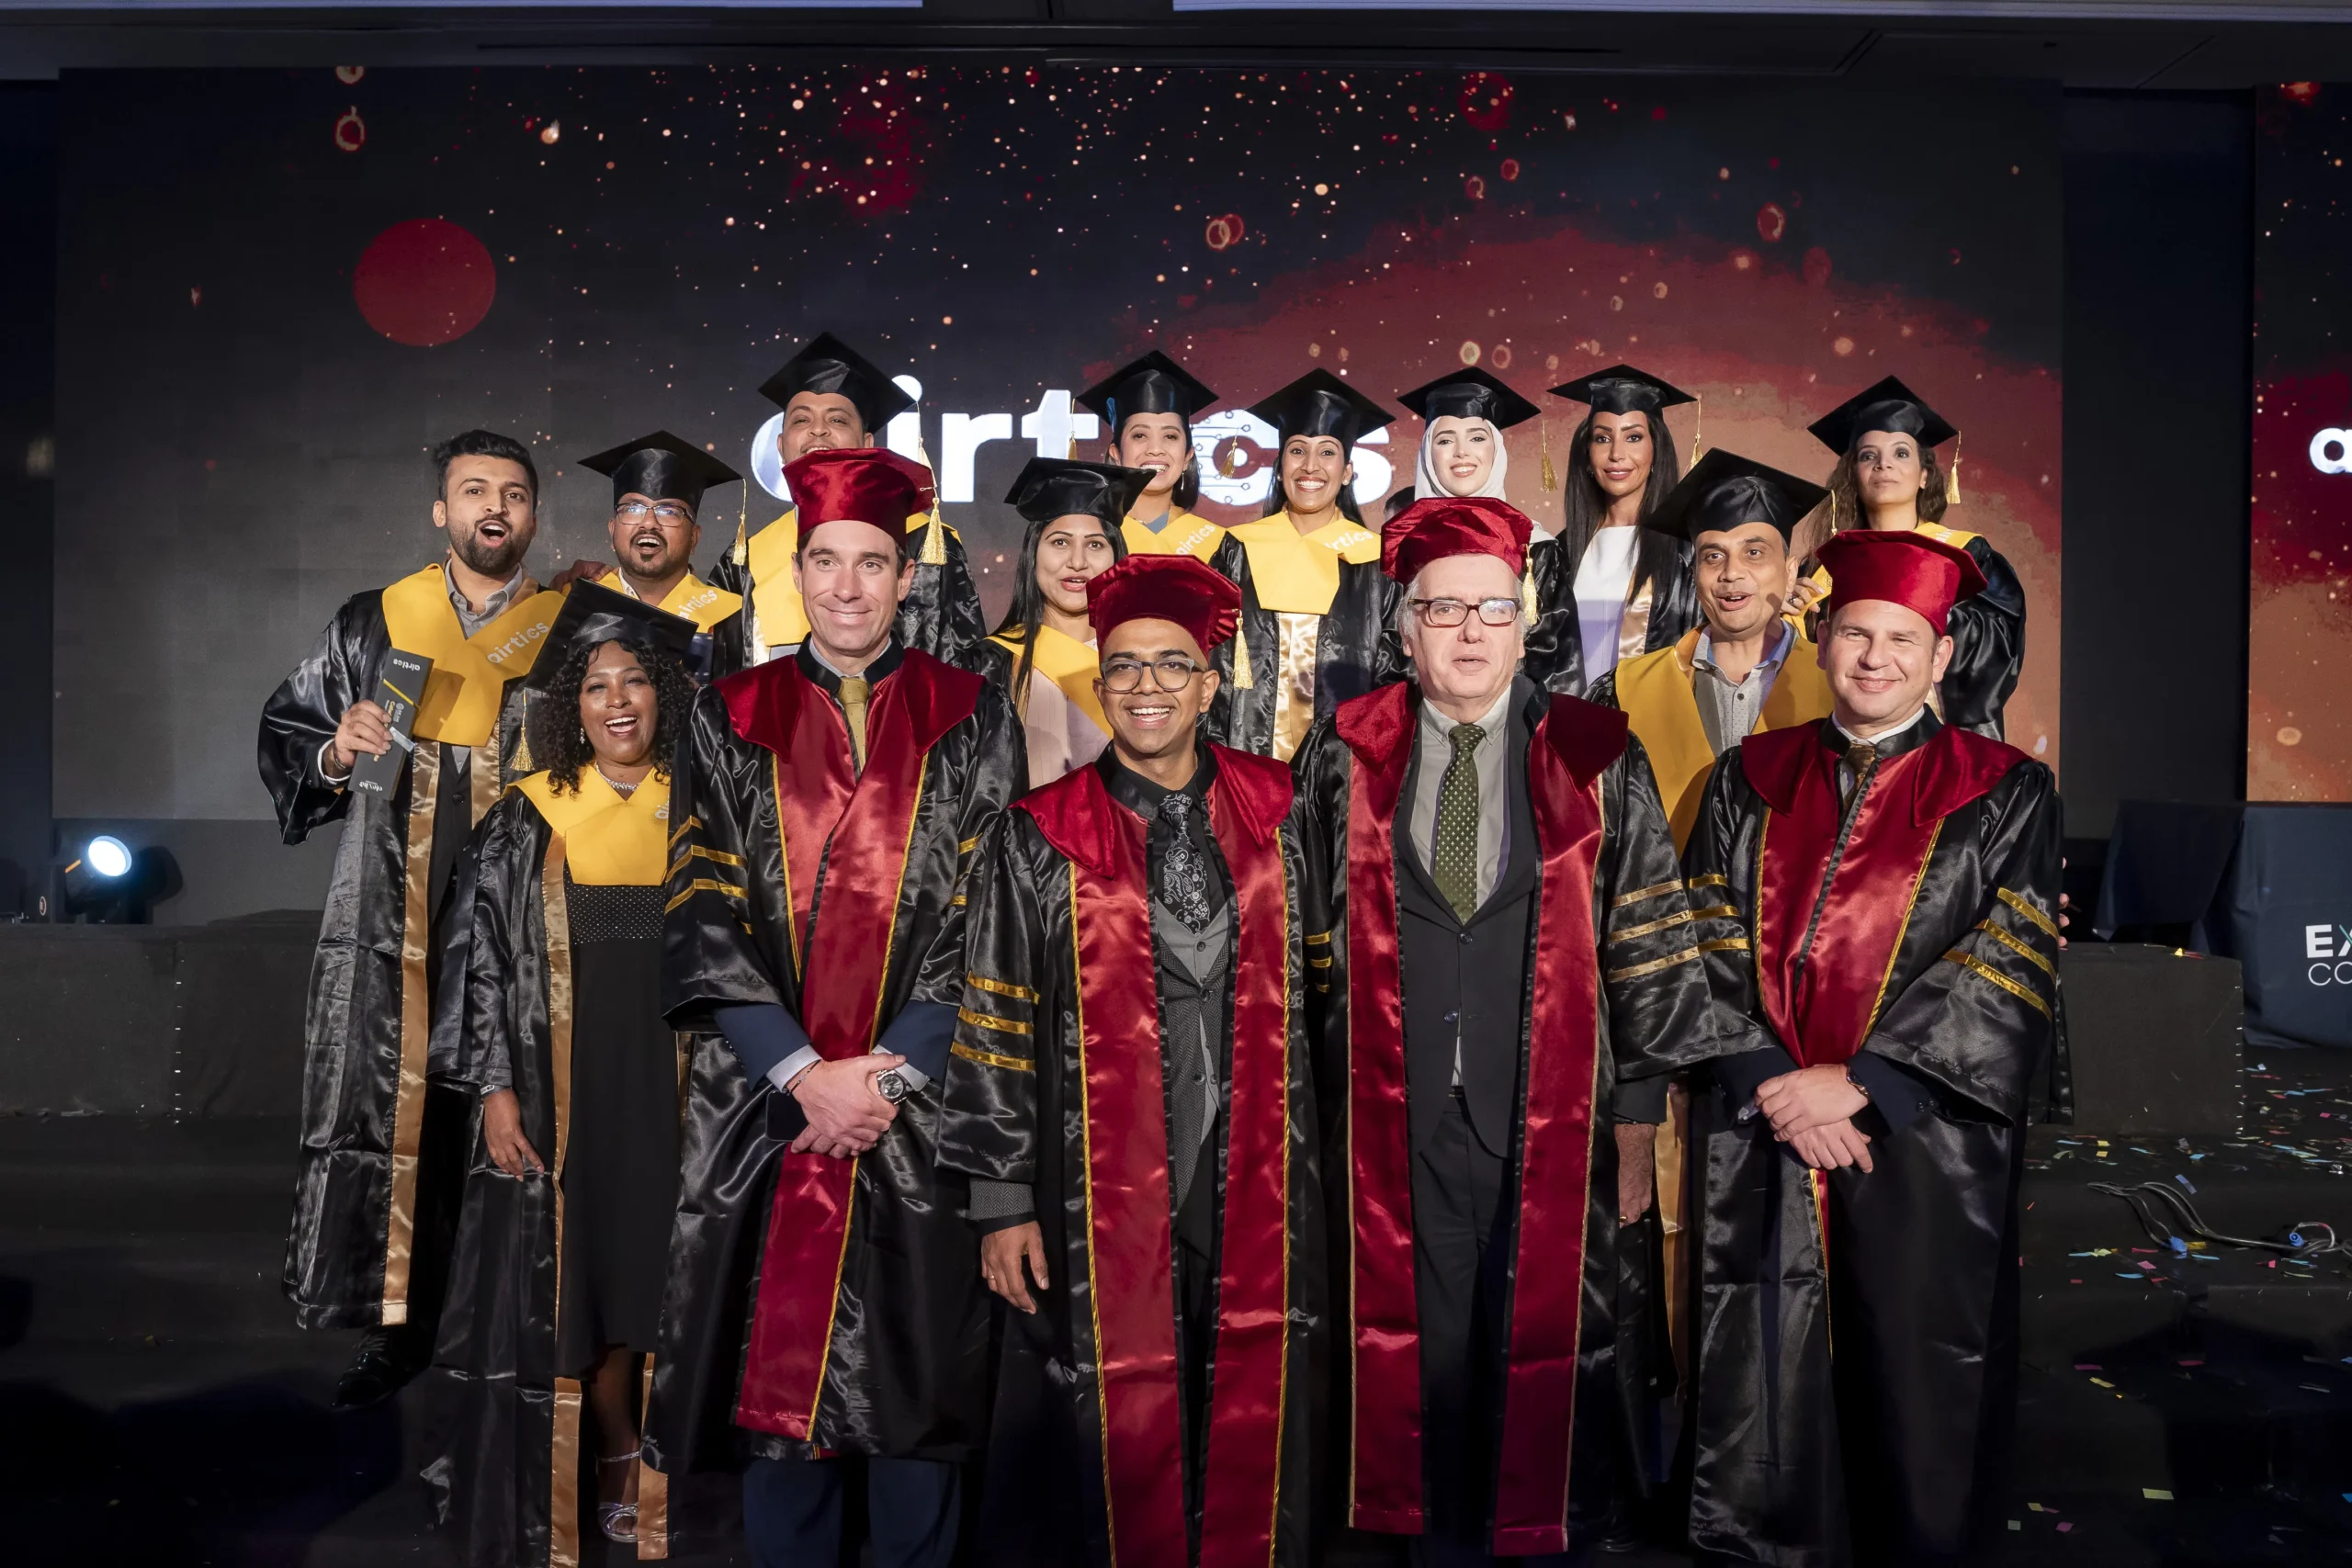
Your Success Story Starts Here
Every image here tells a story of transformation, dedication, and success. Be the next to wear the cap and gown. Enroll today, and let your journey begin.
Every student has a story—of ambition, of challenge, of growth. In their own words, they share how Airtics became a turning point in their learning journey and helped them move closer to their goals.
Pemsith Ravi
Thanks to the support of this prestigious institution – airtics. I was able to earn a master’s degree in data science. I had a fantastic educational experience there, and they possess a highly competent and knowledgeable lecturing panel. Anyone looking to make it major in the data science field should enrol in their course.
Verified Review
Zeeshan Ali
Airtics offers a truly transformative learning experience. The course content is up-to-date, the mentors are incredibly supportive, and the flexibility of the online platform made it easy to balance with my work. Highly recommended for anyone looking to upskill!
Verified Review
Aalaa Shbair
The experience at Airtics College has been tremendous for me. It has illuminated my path and opened the way for me to become a developer of solutions in my workplace. I cherish every moment of this online learning experience and the supportive community of instructors and peers.
Verified Review
Muhammad Fatouh
Airtics offered a great platform that allowed me to take a meaningful step forward in data science while balancing my demanding job as a telecom engineer. If you have a busy schedule and struggle with work-life balance, I encourage you to find a flexible platform like Airtics to pursue your goals.
Verified Review
Al Tayyab Bakhsh
Coming from a non-technical background in marketing, switching to data science was challenging. The faculty at Airtics was incredibly helpful, especially my mentor Miss Piyali, who guided me with patience every step of the way. Their mentorship gave me the confidence to succeed.
Verified Review
Dilnawaz Qureshi
Airtics provides an impressive curriculum for Python Full Stack development that is both well-structured and up-to-date. This comprehensive approach ensures we acquire a thorough understanding of the field and are well-prepared for real-world challenges.
Verified Review
Charuhaas Shenoy
Airtics offers a truly transformative learning experience. The course content is up-to-date, the mentors are incredibly supportive, and the flexibility of the online platform made it easy to balance with my work. Highly recommended for anyone looking to upskill!
Verified Review
Madonna Ghanem
The resources provided by Airtics for AI and ML students are top-notch. The institute has a well-equipped virtual lab with the latest software, allowing us to experiment with complex algorithms. The online library offers a wide range of reference materials and research papers.
Verified Review
Dhruv Narse
Airtics provides a conducive learning environment for data analytics students. They have experienced faculty, and provide access to the latest software and tools used in the industry. This ensures that we are well-prepared for our future careers in the field.
Verified Review
Real-World Capstone Projects
Apply your data science skills to solve real business challenges through hands-on projects. Choose from our curated capstone projects or bring your own organizational problem to create a portfolio that showcases your expertise to future employers.
House Rental Predication
Build a machine learning model to predict house rental prices using market data, property features, and location analysis.
Image Classification
Develop a computer vision system using deep learning to automatically classify and categorize images.
Business Insights Reporting
Create interactive business dashboards that transform raw data into actionable insights and visual reports.
Learn from Industry Leaders & Experts
Learn from the best in the field. Our faculty combines academic brilliance with industry expertise, featuring PhD holders, senior data scientists, and AI researchers from top organizations.
Ms. Piyali Mondal
Head of Department
Ms. Priti Mondal
Associate Faculty
Dr. Abdullah El-Nokiti
Professor
Dr. Mohd Merajuddin Inamdar
Professor
Dr. Madhavi Vaidya
Professor
Dr. Poonam Chaudhari
Professor
Dr. Anup Kumar Maurya
Professor
Dr. Milan Amrutkumar Joshi
Industry Expert
Dr. Mohamed Elhaw
Industry Expert
Dr. Pradeep Tiwari
Industry Expert
Global Student Community
Students from 60+ Countries Worldwide
Frequently Asked Questions
Find answers to common questions about our Advanced Program in Data Science. Learn about program details, requirements, and what to expect from this 6-month certification course.
Why should I join the Data Science program?
Data science isn’t just the way of the future, it’s the way of right now! It is being adopted in all sorts of industries, from health care to route planning, marketing & sales to banking industries and beyond. Even industries such as retail that you might not associate with big data are getting on board. Data science is the fuel of the 21st Century.
What if I fail to attend the classes?
We provide you with live recorded classes of the same session to follow up if you end up missing the same.
How does Data Science differ from Big Data and Data Analytics?
Each of these technologies complements one another yet can be used as a separate entity. Big Data refers to any large and complex acquisition of data. Extracting meaningful information from data is why Data Analytics is used for. While Data Science is a multidisciplinary field that aims to produce broader insights.
What can I expect from the Data Science program?
Accelerated data science career guidance with world-class training on the most in-demand data science and machine learning skills. Training and hands-on experience with key tools and technologies including Python, PowerBi, and concepts of Machine Learning. Upon completing the program, you will be receiving an international certificate from Acacia University Professional Development (AUPD).
Who can join the program?
Aspirants and professionals who are having basic computer programming skills can enroll for the program.
Do I need prior experience in coding to learn the program?
Basic knowledge of programming logic and technology exposure will be helpful.
What are the current capabilities of Artificial Intelligence (AI)?
Google Duplex can make phone calls to make restaurant and hair appointments. Google Deep Mind won a global Starcraft game challenge against gaming pros. Amazon uses AI for book and product recommendations. Websites are using chatbots to answer basic customer queries. Airports are using image recognition for staff security. Rolls Royce is using AI for predictive maintenance and servicing of airplane engines. Informatica is using AI for compliance and data gathering and analysis purposes. Fintech is using AI to combine and analyze more diverse datasets. In healthcare, AI can help analyze more data for preventative medicine. Baidu in China is producing self-driving buses for large cities.
What is the future of Artificial Intelligence (AI)?
Automated transport, taking over dangerous jobs, robots working with humans, improved elderly care, cyborg (organic/bio-mechanic) organisms, environment monitoring and response to climate change goals.
What is TensorFlow?
TensorFlow is an end-to-end open-source platform for Machine Learning (ML). It has a comprehensive, flexible ecosystem of tools, libraries and community resources that lets researchers push the state-of-the-art in ML and developers easily build and deploy ML-powered applications.
Can a data analyst become a data scientist?
Yes. Many data analysts go on to become data scientists after gaining experience, advancing their programming and mathematical skills, and earning an advanced degree.
Should I study Data Analytics or Data Science?
Which you choose is largely a matter of preference. If you’re mathematically minded and enjoy the technical aspects of coding and modelling, a data science degree could be a good fit. On the other hand, if you love working with numbers, communicating your insights, and influencing business decisions, consider a degree in data analytics. Whether you study data science or data analytics, you’ll be building skills for an in-demand, high-paying career.
How tough is deep learning?
The technical skills and concepts involved in machine learning and deep learning can certainly be challenging at first. But if you break it down using the learning pathways outlined above, and commit to learning a little bit every day, it’s possible. Plus, you don’t need to master deep learning or machine learning to begin using your skills in the real world.
Is Machine Learning a good career?
Yes. The average base pay for a machine learning engineer in the US is $123,608, as of April 2022. According to a December 2020 study by Burning Glass, demand for AI and machine learning skills is projected to grow by 71 per cent over the next five years. The same study reports a $14,175 salary premium associated with these skills.
Still have questions?
If you have any other questions or need further information about our Advanced Program in Data Science, don’t hesitate to contact us. Our admissions team is here to help you take the next step in your data science career.